Understanding Command Queues in NVMe
What Is a Command Queue?
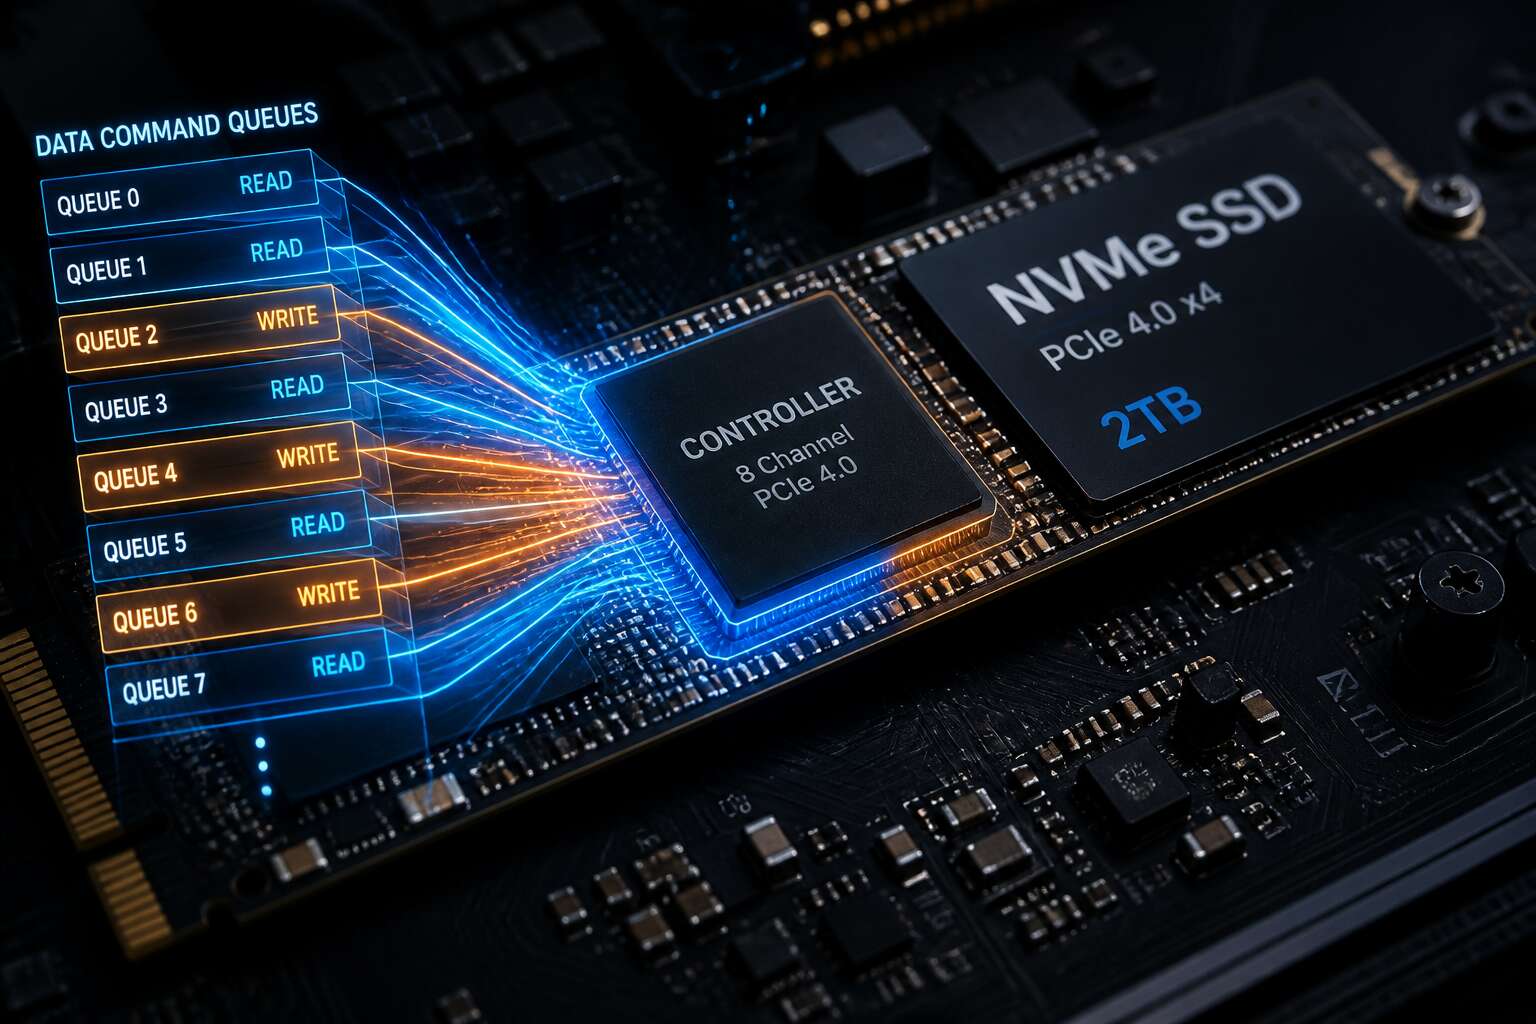
Every command a system sends to an NVMe drive waits in a command queue. It is a buffer where the host stacks read and write requests before the controller processes them. In NVMe, each queue pair has two sides: a submission queue and a completion queue. The host fills one, the controller works through it, then posts results to the other.
This design is the reason nvme queue depth matters. It defines how many commands can occupy that buffer at once. NVMe supports queues with up to 64K entries, yet the useful depth depends on the workload and firmware.
- Submission queues hold pending operations
- Completion queues signal finished operations
- Higher depth allows more simultaneous commands
A deeper queue keeps the drive busier, but only when the system can generate enough requests to fill it. A shallow queue leaves the controller idle. Matching nvme queue depth to your access pattern is the real work!
How NVMe Queues Differ from SATA
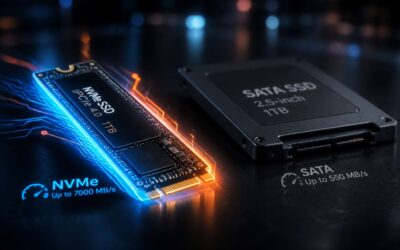
SATA’s entire command path hinges on 32 slots. NVMe gives you 65,535 queues, each with room for 64K commands. That is the raw difference behind nvme queue depth.
With SATA, one queue forces every read and write to stand in a single line. A heavy sequential transfer can starve random I/O. NVMe breaks that bottleneck! The host can assign separate queues to separate workloads, so a database transaction never blocks a video stream. The controller processes commands in parallel instead of waiting for the queue to drain.
However, a larger depth is not a free performance boost. The operating system and driver must actually fill those queues, which makes nvme queue depth a factor in every storage decision. When they do, the drive operates with far less idle time, which matters for latency sensitive workloads in South African data centres.
The Role of Multiple Queues
Most people think nvme queue depth is about making the drive work harder. That is only half of it. The real trick is understanding command queues as a system of independent lanes. Each queue holds a set of commands, and the controller decides which to execute first. Multiple queues give you the freedom to separate traffic. A backup process can fill one queue while your CRM uses another. The role of multiple queues is to prevent one workload from blocking another.
- Queue A handles random reads.
- Queue B manages sequential writes.
- Queue C deals with metadata updates.
Without this separation, nvme queue depth becomes just a number. With it, you get predictable latency. That is what matters when your users in Johannesburg expect instant responses.
Why Queue Depth Matters for Storage Performance
Queue Depth and IOPS
Most storage bottlenecks are not hardware failures. They are queue depth miscalculations. An NVMe drive set to a queue depth of one leaves the controller idle for most of its cycle. Queue depth and IOPS are inseparable. IOPS is the rate of completed operations, but it cannot rise without enough commands waiting in line. Deeper queues allow the controller to:
- Reorder operations for optimal flash access
- Group reads and writes that target similar pages
- Balance workloads across parallel memory channels
The relationship is not linear. Doubling the queue depth does not double the IOPS. Scheduling overhead grows with each pending command. Yet shallow queues prevent the drive from reaching full utilisation. For enterprises, nvme queue depth tuning often delivers more performance gain than hardware upgrades. We see this daily with South African businesses running high-volume databases. NVMe queue depth separates a responsive system from a sluggish one.
Impact on Latency and Throughput
Latency is where shallow nvme queue depth becomes visible. A drive handling one command at a time adds waiting time between every operation. Throughput suffers differently. The controller cannot batch writes, so the flash media sits idle between bursts of activity. Storage administrators often mistake this for ageing hardware.
Consider what happens during peak business hours. A database server with nvme queue depth of one might show high latency while the drive itself remains underutilised. Throughput measurements look healthy, but individual requests stall.
The practical effects appear as:
– Slow transaction responses
– Uneven application performance
– Storage queues building inside the operating system
Each symptom traces back to the same root cause. The drive wants more work, but the queue limits how much it receives. Understanding this distinction changes how South African teams evaluate storage performance.
The Relationship Between Queue Depth and Parallelism
Parallelism explains why nvme queue depth matters more than raw drive speed. Storage controllers reach their rated performance by keeping many commands in flight, not by completing each one faster. A deeper queue lets the drive reorder operations and group reads or writes to match flash behaviour. Without that depth, the controller processes one request, waits, then starts the next. The drive never operates at full capacity.
The relationship between queue depth and parallelism shows up clearly in production. When the queue stays populated, the controller can:
- Merge adjacent writes
- Prioritise read requests
- Keep flash media busy across multiple channels
South African workloads, particularly databases, depend on this parallel behaviour. Setting nvme queue depth too low leaves the drive idle while application latency climbs for no obvious reason.
Common Workload Scenarios
Every database server in Johannesburg or Cape Town contends with a hidden constraint: the number of commands waiting in the NVMe queue. A shallow nvme queue depth turns the fastest enterprise SSD into a sluggish performer, especially during month-end processing or batch exports. The drive cannot see the full picture of read and write demand, so it shuffles operations one by one.
Common workloads reveal the difference. Consider these scenarios:
- Online transaction processing, where thousands of small random reads arrive at once.
- Data analytics, which relies on sustained sequential reads across large files.
- Virtual machine storage, where mixed workloads from many tenants compete for controller time.
Each scenario needs enough depth to let the controller group similar requests and reduce waiting. Without proper nvme queue depth, applications stall while the drive idles.
How to Measure and Interpret Queue Depth
Tools for Checking Queue Depth
Measuring nvme queue depth requires a different lens than observing ordinary storage metrics. I often reach for `nvme-cli` on Linux or `iostat` with extended statistics, because these tools reveal the number of commands waiting in each submission queue. The raw value means little on its own! A queue depth of 32 on a busy database server tells a different story than the same value on an idle file server.
Here is what I look for when interpreting these numbers:
- Queue depth rising while IOPS stays flat suggests saturation, not efficiency.
- Latency creeping upward alongside queue depth points to contention inside the controller.
Interpreting nvme queue depth is an act of patience. You must watch the metric in motion, paired with device utilization, rather than treating it as a static figure.
Reading nvme-cli Output
The nvme get-feature command exposes the negotiated queue parameters. Running nvme get-feature /dev/nvme0 -f 0x7 returns the submission queue count and the queue size, which is the controller’s maximum nvme queue depth. The true depth in flight, however, comes from comparing the submission queue head and tail pointers over consecutive reads. A persistent gap between them represents commands waiting for execution.
Reading the raw output demands context! A gap near the queue size with stable latency figures indicates the controller is handling the workload. The same gap with latency climbing suggests the device is struggling. For my part, I scan for:
– The highest nvme queue depth value the controller permits
– The head and tail pointer delta across samples
– The relationship between that delta and observed completion times
These three readings tell me whether the queue is performing or merely filling.
Understanding Queue Depth Metrics
Numbers alone will mislead you. Interpreting queue depth metrics requires observing how the head and tail pointers move across time. A static gap at a moderate level with flat completion times signals healthy throughput. The same nvme queue depth approaching the controller’s ceiling while latency climbs tells a different story: the drive is overwhelmed.
I focus on three relationships:
– The delta between pointers at each sampling interval
– Whether that delta tracks the completion rate
– How the gap behaves when workload intensity shifts
These measurements reveal whether the nvme queue depth reflects actual pressure or remains pure headroom. The queue is a dynamic component, and the metrics expose its current state.
Thresholds for Optimal Performance
Setting an nvme queue depth threshold feels tidy, but storage systems rarely cooperate! I have seen drives hum along at depth 32 and others choke at 16. The threshold is not tuned once. It moves with firmware revisions, workload composition, and temperature.
Measure in small windows. Poll the admin queue and I/O queues together, then plot the gap between head and tail pointers against completion latency. When the gap grows while completions stall, you have crossed the ceiling. A flat gap with steady latency means headroom remains.
- Watch where latency rises faster than throughput.
- Compare the same nvme queue depth across read-heavy and write-heavy bursts.
- Test at intervals that match your own application cycle, not a synthetic benchmark.
Interpreting these thresholds requires patience. The drive that performs well at depth 64 during sequential writes may struggle at depth 32 under random reads. That asymmetry is the signal you need.
Tuning Parameters in Linux
Once you accept that thresholds shift, the next step is measuring them on Linux. The kernel exposes several tuning parameters, but the effective nvme queue depth is rarely the value you set. The module parameter io_queue_depth sets the ceiling, yet the driver can lower it dynamically. Poll /sys/block/nvme0n1/device/queue_depth during a live workload.
Interpreting that number requires context. Track the gap between submitted and completed commands over time. A widening gap with stable latency means the queue is absorbing work. A widening gap with rising latency means the controller is saturated.
A few measurements capture the full picture:
- Configured depth versus effective depth
- Completion rate during sustained bursts
- Frequency of busy responses from the controller
Read those values against your own latency ceiling. The nvme queue depth that handles sequential writes can be the same value that destroys read latency under contention.
Optimizing NVMe Queue Depth for Different Applications
Database Workloads
Database workloads are a fractious lot. A production SQL system with a heavy transaction log will demand a generous nvme queue depth, while a reporting replica handling daytime analytics may prefer far less. The difference is not a matter of preference; it is arithmetic.
I have watched database administrators wrestle with storage, and nobody agrees on the right depth. Some swear by 32, others insist on 128! Neither is wrong, because the workload defines the answer. A transactional database with thousands of concurrent users accumulates requests at a furious pace. A reporting database does its work in deliberate sweeps.
This is why database workloads need individual attention:
- Transactional engines push many small concurrent operations.
- Analytical engines aggregate large sequential reads.
- Mixed workloads oscillate between both behaviours, often within the same hour.
Each application presents distinct demands to the controller. Matching the nvme queue depth to those demands prevents the quiet degradation that storage administrators mistake for hardware fatigue.
Virtualization and Hypervisors
A hypervisor distributes the command queue across many virtual machines, and each VM assumes it owns the hardware. The nvme queue depth must accommodate request bursts from all tenants simultaneously. A low setting stalls the storage controller during boot storms. A high setting permits one noisy VM to consume the entire queue.
The optimal value depends on the virtual machine mix:
- Boot storms generate bursts of small single block reads.
- Backup agents write large sequential streams.
- Live migration sends sustained mixed traffic.
Workload patterns change throughout the day, so a static configuration rarely fits every phase. The controller must absorb the transitions without starving individual VMs.
High-Performance Computing
High performance computing uses the nvme queue depth as a shared resource. An MPI job with 4,096 ranks staggers writes through checkpoint phases, then floods the controller during gradient reads. Ranks block at synchronisation barriers when I/O falls behind, so the queue must remain deep enough to absorb the entire job’s allocation.
- Checkpoint dumps write large sequential blocks.
- Metadata-heavy ranks issue small, random lookups.
- Job schedulers launch thousands of processes simultaneously.
A shallow queue triggers cascading timeouts across compute nodes, since every rank waits on the slowest one. I prefer a generous allocation, held steady by backpressure, to let the controller pace the flow without throttling individual ranks.
Edge and Embedded Storage
Edge devices rarely enjoy the luxury of deep queues. In my work across mining and logistics sites, I have seen nvme queue depth contend with thermal limits and power budgets. A telematics unit and a surveillance node each run a fixed workload, so the multi-queue advantages disappear.
What matters here is predictable latency. A shallow queue with disciplined submission often beats a deep queue that invites bursty behaviour. Flash wear concentrates on specific cells when queues overflow, quietly shortening device lifespan.
Workloads that demand special attention:
- Continuous sensor logging with small, periodic writes
- Over-the-air firmware updates arriving as large sequential bursts
- Local inference models streaming read-only weights
Each workload pulls the nvme queue depth in a different direction, and no single setting fits them all.
Cloud Storage Environments
Cloud storage environments invert the edge problem. Where embedded devices starve for queue capacity, cloud tenants can over-provision without seeing the physical consequences. The nvme queue depth you configure inside a virtual instance does not map directly to hardware rings. The hypervisor and the storage fabric insert their own arbitration layers.
These layers change submission queue behaviour. A high nvme queue depth can cause head-of-line blocking in shared infrastructure, while a shallow queue underutilises the network path. Provider quality of service limits often dictate the effective ceiling.
Consider three factors when setting queue depth in the cloud:
– The IOPS cap assigned to your volume
– The latency distribution of the underlying storage backend
– The number of virtual CPUs that can feed the queue
Each factor shifts the optimal value.
Identifying Bottlenecks
Most performance problems do not announce themselves as queue exhaustion. They appear as strange latency spikes that shift with the workload intensity. The nvme queue depth interacts with application logic in ways many administrators find counterintuitive. A database that submits thousands of small reads may thrash its storage subsystem, whereas the same nvme queue depth configured for a video encoder delivers exactly the throughput required. The difference lies in how each application consumes completions.
CPU starvation is a primary bottleneck. When processors cannot poll completion queues fast enough, the entire submission pipeline backs up. Conversely, some workloads stall because they issue too few commands to keep the device busy. The diagnosis requires watching the actual ratio of pending commands against the configured depth. A queue that never reaches half its depth indicates an application limitation, not a hardware fault.
Signals that point to an nvme queue depth bottleneck include:
– Increased command latency that scales linearly with depth
– Stall patterns in the submission queue entries
– Sudden throughput drops when expanding queues beyond a certain size
Single-threaded applications suffer from a different problem. They cannot generate enough outstanding I/O to saturate the device, leaving the PCIe link idle. Their bottleneck sits inside the application’s loop logic, and adjusting the nvme queue depth does little to help. The queue depth must match the concurrency that the application can actually produce, not the theoretical maximum of the device.
Latency-sensitive workloads, such as market data processing or financial trading systems, often require shallow queues. These applications trade raw throughput for predictable response times. A deeper nvme queue depth increases the variability of completion times, which breaks their performance models. The optimal setting balances the polling interval against the queue capacity. Each application type has a signature pattern, and proper configuration starts with identifying that signature. The tricky part is that the signature changes as the workload scales, meaning the nvme queue depth that works today may become the bottleneck tomorrow.
Common Misconceptions and Best Practices
Myth: Higher Queue Depth Always Means Faster
Higher nvme queue depth does not always mean faster performance. I’ve seen queue depth set to 1024 on a single NVMe drive turn latency upward while throughput stayed flat. The controller spends more time reordering requests than completing them.
Higher queue depth only helps when the workload has enough concurrent I/O to fill the queue. A database with thousands of active transactions might benefit. An application issuing single random reads just adds waiting time. The sweet spot depends on the device’s internal parallelism and your access pattern.
Consider these scenarios where high queue depth backfires:
- A virtual machine with one vCPU doing sequential writes
- A web server handling small synchronous reads
- A backup stream that already saturates the PCIe link
In each case, the device reports queue full events early, which suggests the nvme queue depth is amplifying contention rather than fixing it.
Balancing Queue Depth and CPU Overhead
Queue depth is not free. Every command sitting in the queue consumes host CPU cycles for submission, completion polling, and interrupt handling. I have watched administrators double the nvme queue depth on a busy controller and see CPU utilisation climb while IOPS stayed flat.
The common misconception is that a deeper queue hides latency. It does not. It shifts the cost from the device to the host. When the CPU becomes the bottleneck, the nvme queue depth amplifies overhead instead of improving throughput.
- Deeper queues shift the bottleneck to the host CPU.
- Higher nvme queue depth does not scale without available cores.
- The device is not always the cause when IOPS stall.
Real balance depends on the device’s internal parallelism, the workload’s concurrency, and the operating system’s ability to reap completions without starving other processes.
Configuring Device and Driver Limits
The datasheet promised a maximum nvme queue depth of 1024, so the administrator set it and watched IOPS fall. The device was fine. The driver was silently capping its submission queue at 32 commands. The storage team blamed the SSD, but the real culprit was the driver.
Administrators fight three common misconceptions about configuring limits.
- The device limit is the default working limit.
- Driver module parameters are never worth changing.
- One queue depth setting covers both submission and completion.
The driver’s queue depth is a separate negotiation. Loading the module with nvme_core.io_queue_depth=1024 without checking the controller’s actual capacity produces no throughput gain. For South African enterprises running mixed local and cloud workloads, this mismatch often appears as mysterious IOPS plateaus.
Monitoring and Adjusting in Production
Two NVMe drives, identical specs, wildly different behaviour: one saturates the link, the other throws an IOPS tantrum at 500K. The difference is often not the NAND, but where the driver thinks the queue ends. The kernel’s `nvme_core.io_queue_depth` parameter defines the maximum number of pending commands for each submission queue, and it silently overrides vendor claims. Operators who assume the device’s theoretical peak is the operating point are in for a rude awakening.
Common wisdom in storage circles is often just shared confusion. Consider the prevailing beliefs:
1. The driver’s default queue depth is a suggestion, not a fixed law.
2. Raising the depth always yields linear gains.
3. The completion queue depth mirrors the submission queue.
Wrong, wrong, and wrong again. For South African environments juggling on-prem latency with cloud bursts, these assumptions create a performance ceiling that no amount of hardware swapping will fix. The driver is the moderator, and it plays by its own rules.
Monitoring in production is a passive sport, not a reactive one. You observe, you record, you correlate, and you adjust with surgical precision. A sudden IOPS plateau at 750K while your `nvme queue depth` is set to 1024 is a clue, not a crisis. Rather than blindly slamming the parameter higher, watch the `iostat` average queue size over a 24 hour cycle. If the driver never allocates more than 64 commands, the host is the bottleneck, not the drive. Adjust the module parameter with intent, then let the telemetry speak for a week. The device will politely ignore excessive depth requests, and your latency charts will tell you if the change was worthwhile or just vanity for the performance dashboard.

0 Comments